During #30DayMapChallenge I was hunting for 3D maps, and there it was: a post showing a flight over a mountain, made using an recently open-sourced library, Procedural GL JS! Not Google, not Mapbox.. not MapLibre GL 🙂
I will show some details about the library, and a few examples of my implementation. But first, a few words about 3D maps on the web.
This will be a somewhat technical post, if you are interested bear with me, if not, you can go directly to the Showcase section and look at the beautiful pictures in the article, or enjoy the videos.
Also, this article is an example article, and must be further documented, sorry for possible mistakes.
Let's start with 3D maps
They have been in the digital realm for a while, and on paper since ages. Even from the oldest times people have tried to represent the terrain in a 3D perspective, using different techniques, transposed into beautiful mountains profiles. Raised-relief maps have existed since the Qin dynasty (221–206 BCE) of China, and a Bronze Age slab found in France is the oldest 3D map in Europe, and is believed to date from the early Bronze Age, between 1900 BC and 1650 BC. Also, old topographical maps represented various forms of relief.


If we refer only to digital Cartography, there are many proprietary as well as open-source applications that can create a 3D map view starting from the terrain elevation, most reknowned being ESRI's ArcGIS and QGIS.
Modern 3D cartography maps are created using 3D models from local measurements of the terrain, high resolution photography, or from satellite immagery and aerial photography. Below you can see beautiful images of Washington state geology, derived from LiDAR cloud point data. And a 3D model of El Capitan, from a LiDAR scan consisting of over 36 million points.


Below are some examples of 3D visualizations of LiDAR data using PDAL for point cloud processing and Entwine (a webGL based library) and Potree to render the models in the browser.


Triangulation
Usually, a 3D map is created from a series of points that contain the terrain elevation in metres, which are processed into a triangulated irregular network (TIN) using specific algorithms based on the Delaunay criterion and the Voronoi tesselation. Further, this model can be smoothed, and an aerial image can be drapped over it, and this is the 3D terrain view from Google or Here!
Many sensors used in GIS applications (for example LIDAR), generate dense point clouds. Such applications often take advantage of more advanced data structures: for example, Triangulated Irregular Networks (TIN) that can be the base for Digital Evelation Models (DEM) and in particular for the generation of Digital Terrain Models (DTM). Point clouds can also be enriched by classification information that segments the points into ground, vegetation and building points (or other user-defined labels). [ src ]
The specific data structures used for obtaining 3D models are:
- TIN: Triangulated Irregular Network, a 2D triangulation structure that connects 3D points based on their projections on the horizontal plane.
- DSM: Digital Surface Model, a model of the whole scanned surface including buildings and vegetation. We use a TIN to store the DSM.
- DTM: Digital Terrain Model, a model of the bare ground surface without objects like buildings or vegetation. We both use a TIN and a raster to store a DTM.
- DEM: Digital Elevation Model, a more general term that includes both DSM and DTM.


WebGL
If we go further, ArcGIS Online, CesiumJS, VTS Geospatial, iTowns, MapBox can render 3D maps in the browser. And the gaming applications. We will see a lot of 3D mapping for the web revolves around the WebGL API.
WebGL is a web based OpenGL API written in JavaScript. It can render 3D models of a terrain transposing the real world coordinates into screen coordinates (projecting the polygons - like any mapping software).
WebGL (Short for Web Graphics Library) is a JavaScript API for rendering interactive 2D and 3D graphics within any compatible web browser without the use of plug-ins. WebGL is fully integrated with other web standards, allowing GPU-accelerated usage of physics and image processing and effects as part of the web page canvas. WebGL elements can be mixed with other HTML elements and composited with other parts of the page or page background.
WebGL programs consist of control code written in JavaScript and shader code that is written in OpenGL ES Shading Language (GLSL ES), a language similar to C or C++, and is executed on a computer's graphics processing unit (GPU). WebGL is designed and maintained by the non-profit Khronos Group.
In WebGL, you can cover a polygon 3D model with real-life imagery using the UV mapping technique.
UV mapping is the 3D modeling process of projecting a 2D image to a 3D model's surface for texture mapping. The letters "U" and "V" denote the axis of the 2D texture because "X", "Y", and "Z" are already used to denote the axis of the 3D object in model space, while "W" (in addition to XYZ) is used in calculating quaternion rotations, a common operation in computer graphics.

There are several frameworks that make working with WebGL easier, most of them written in JavaScript, like Three.js, Babylon.js, MapBox GL, CesiumJS, MapLibre GL, and Unity game engine(C#).
Here is a comprehensive list of open-source projects categorized as Webgl. There are many open-source projects, but we must be aware that at any moment they could go closed-source, or you may need to pay for specific services to use the library at its full potential.
Now, that you have seen some of the alternatives for rendering 3D maps on the web, let's get back to the new (open-source) kid in town, Procedural GL JS.
Procedural GL JS
Felix Palmer, the creator of Procedural GL JS, came with this surprise near the end on #30DayMapChallenge on Twitter, when the challenge was to make a map with a new tool. Right in time!
After 7 years of closed-source, I've changed direction and just launched: Procedural GL JS, an #opensource #webgl #javascript #threejs #dataviz library, for rendering 3D terrains.
Below, you can find some details about the library, from the documentation. And here is the GitHub repository.
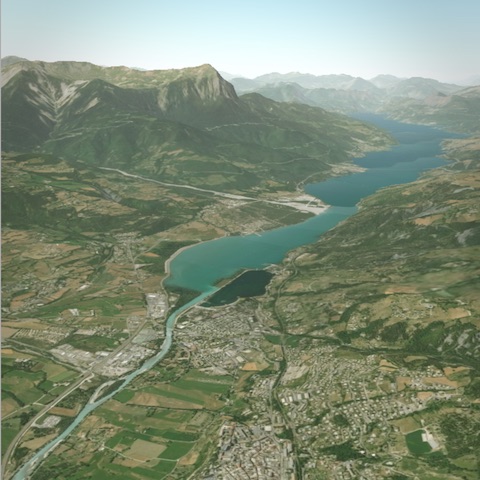
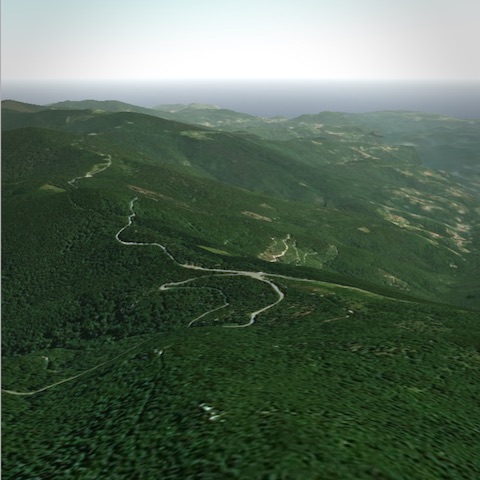
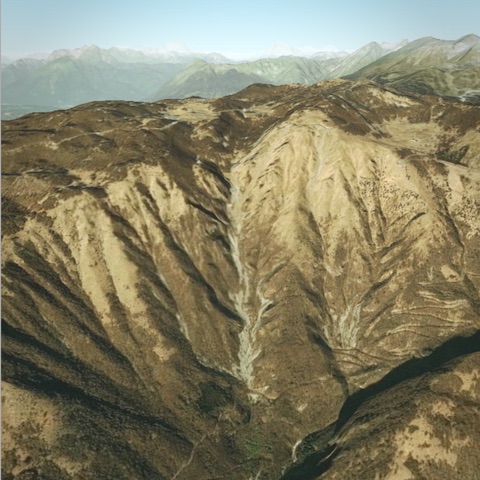
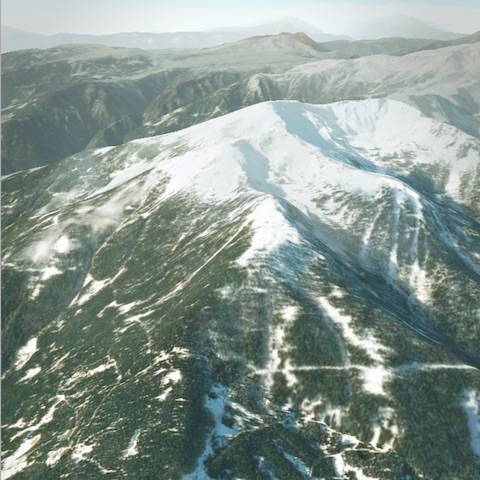
Procedural GL JS is a library for creating 3D map experiences on the web, written in JavaScript and WebGL. It is built on top THREE.js. It provides an easy-to-use, but powerful framework to allow 3D maps to be embedded into web pages. Super-fast loading and optimized for mobile devices.